
 New
Structure
Edo PDH/PDL Levels
New
Structure
Edo PDH/PDL Levels
The previous day, week, month and year highs and lows, drawn automatically as labelled levels that do not repaint
33 indicators for TradingView, 25 of them free and open source. Built from daily market use, documented with a manual and a tutorial each.
Each card says what the tool draws. Free scripts open on TradingView directly; premium ones show the price.
New
Structure
Edo PDH/PDL Levels
The previous day, week, month and year highs and lows, drawn automatically as labelled levels that do not repaint
 New
Structure
Edo Mitigation Blocks
New
Structure
Edo Mitigation Blocks
The order block behind each impulse, tracked to its retest as Pending, Mitigated or Broken
 New
Structure
Edo Breaker Blocks
New
Structure
Edo Breaker Blocks
Only the order blocks that fail and flip their role, each breaker tracked as Active, Tested or Failed
 Structure
Edo Swing Levels
Structure
Edo Swing Levels
The last swing high and low always in view, with the Strong level that defends the trend set apart from the Weak one
 Structure
Edo Swing State
Structure
Edo Swing State
Every swing labelled HH, HL, LH or LL, resolved into a single market state
 Structure
Edo Premium Discount
Structure
Edo Premium Discount
Premium, Discount and Equilibrium Zones from Confirmed Swing Structure
A weekly structural read of the market, built from our own indicators.
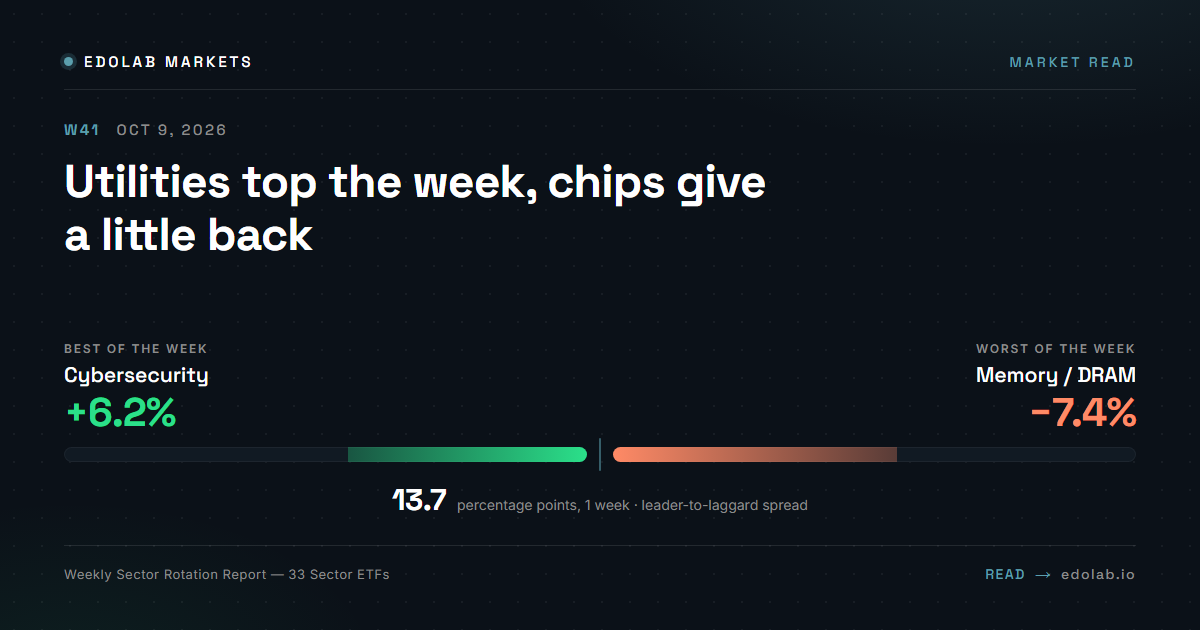
This combination of defensive sectors leading alongside some growth areas like Cybersecurity (HACK) at +6.24% and China Tech (KWEB) at +4.48%, suggests a cautious but selective risk-on environment.
Weekly Radar
Week of Oct 5–9, 2026
Market climate: green · 6 stocks on the radar
Revenue +93% year over year, 4 quarters in a row
10 of 13 directional reads bullish
Revenue +38% year over year, 4 quarters in a row
10 of 13 directional reads bullish
Revenue +53% year over year, 4 quarters in a row
6 of 13 directional reads bullish
Watchlist, not signals. No entries, no targets, not investment advice. Do your own research.
Free scripts are open source on TradingView. Premium scripts are not available for purchase yet.
Open source, published directly on TradingView. No account here, no payment.
Add them to your chart from the script page. The code is public.
The full structural and momentum stack: multi-timeframe consensus, dashboards and sensitivity profiles.
Not available for purchase yet.
Four rules behind every script. The full method, with 22 indicator combinations, lives in Methodology.
We read market context first. Indicators confirm structure, never replace it.
Only information that adds decision value is kept. Anything that introduces noise or confusion is removed.
Each indicator has a defined role inside a workflow. No stacking for the sake of it.
Repeatable process over forecasting. Every script runs in our own daily routine before it is released.
Don't have TradingView yet? Sign up here and get $15 off your next plan.
Affiliate link
Open one on your chart, read its manual, and build context you can check for yourself.
Also: Track record · Chart ideas on TradingView → · Calculators